What This Calculator Is, Honestly
An SEO ROI calculation is a short chain of arithmetic on numbers you already own. This page documents that chain completely: the exact formula, where each input comes from, a worked example, and the failure modes that make most SEO forecasts fiction. There is no input widget here hiding the math behind a “your ROI is 340%!” reveal, and that is deliberate: the model fits in six spreadsheet rows, and a calculator that conceals its assumptions is a sales tool, not a forecasting tool. Copy the formulas below into any spreadsheet and the numbers are yours to audit.
The one thing arithmetic cannot supply is measured inputs. That is where tooling genuinely helps: your analytics, Search Console, and CRM provide the baselines, and AEO Goal supplies the visibility side, from the free AI visibility scan that establishes your technical starting point to AI visibility tracking that measures whether shipped work moved anything.
The Formula, Step By Step
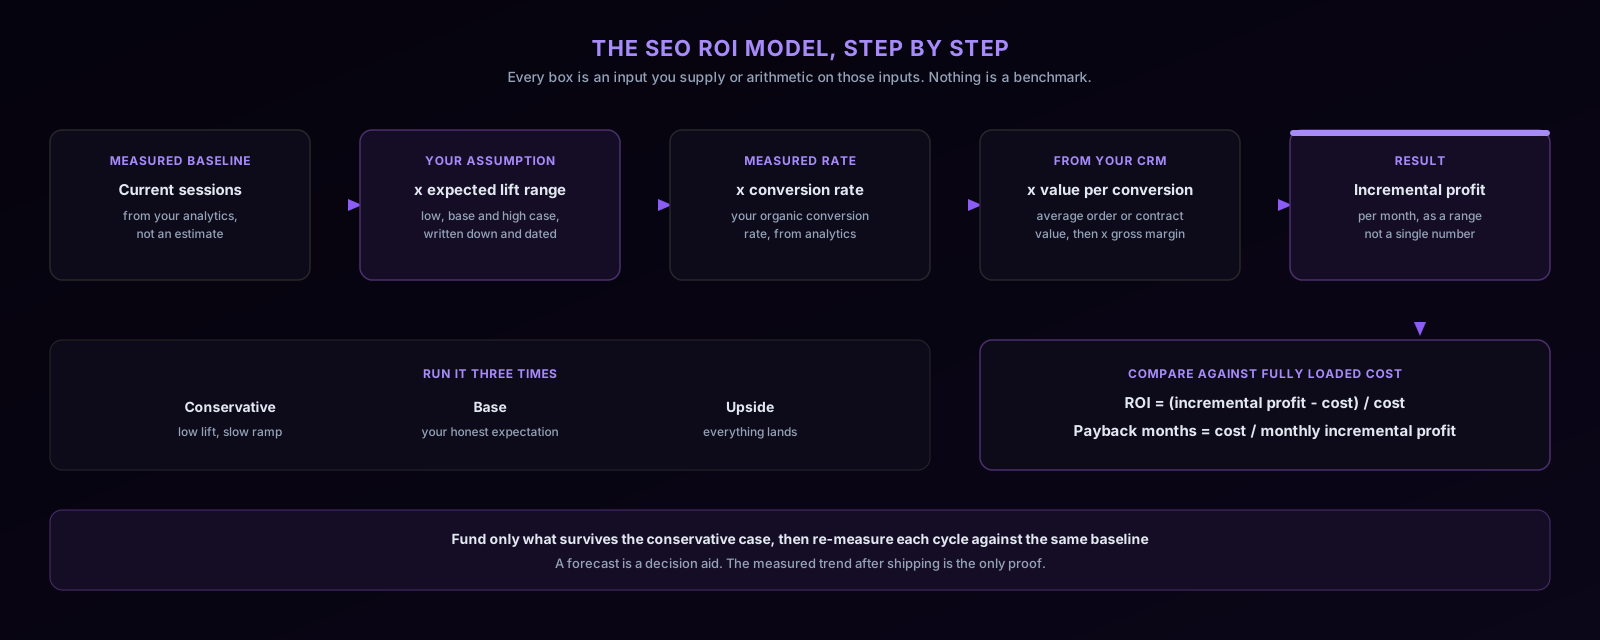
The full model, in order:
incremental sessions    = baseline monthly sessions x expected lift
incremental conversions = incremental sessions x conversion rate
incremental revenue     = incremental conversions x value per conversion
incremental profit      = incremental revenue x gross margin

ROI            = (incremental profit - cost) / cost
payback months = cost / monthly incremental profit
Every line is either a measurement or arithmetic on measurements, with exactly one exception: expected lift. That is the assumption the whole forecast hangs on, which is why it must be entered as a range (a low, base, and high case), written down, and dated. A forecast whose lift assumption cannot be found six months later is unauditable by design.
Two structural notes. First, the model runs on profit, not revenue: skipping the gross margin line is the most common way SEO business cases overstate themselves, especially in ecommerce. Second, cost means fully loaded cost: tooling, content production, engineering time, and agency fees, not just the software line item.
Where Every Input Comes From
| Input | Source | Nature |
|---|---|---|
| Baseline monthly sessions | Your analytics, organic segment | Measured |
| Expected lift range | Your judgment, informed by gap analysis | Assumption, stated as a range |
| Conversion rate | Your analytics, organic segment | Measured |
| Value per conversion | Your CRM or order data | Measured |
| Gross margin | Your finance team | Measured |
| Fully loaded cost | The actual budget | Measured |
The rule this table encodes: no imported benchmarks. A conversion rate borrowed from someone’s aggregate industry study makes the output precisely wrong, because that number reflects other companies’ traffic mix, pricing, and funnels, not yours. If you lack a measured rate because the site or segment is new, widen the range until it honestly reflects your ignorance, and say so in the reporting. A wide honest interval is a better decision input than a narrow borrowed one.
Sizing the lift assumption itself is the job of the companion organic traffic calculator, which builds the sessions estimate bottom-up from impressions and click-through rather than asking you to guess a percentage.
A Worked Example
All inputs below are illustrative placeholders to show the mechanics. Replace every one with your own figures; none of them is a benchmark or a typical value.
Suppose a B2B site measures 20,000 organic sessions per month and is evaluating a six-month content and technical program costing 30,000 total. The team’s base-case lift assumption is 15% by month six, conservative case 5%, upside 30%. Measured organic conversion rate to qualified lead is 2%, the sales team closes 20% of qualified leads, contract value is 5,000 with 80% gross margin, so value per converting session works out through the funnel rather than being guessed.
Base case: 20,000 x 15% = 3,000 incremental sessions; x 2% = 60 leads; x 20% = 12 deals; x 5,000 x 80% = 48,000 incremental profit per month at full ramp. Conservative case, same chain at 5%: 16,000 per month. Against a 30,000 cost, even the conservative case pays back within a few months of reaching full ramp, so this investment survives its worst written-down case, which is the actual test.
Notice what did the work there: not optimism, but the fact that every rate after the lift assumption was measured. When the same arithmetic produces a payback only in the upside case, the honest conclusion is “this is a bet on the lift assumption,” and it should be funded, or not, as exactly that.
Sensitivity: Which Input Moves The Answer
Before trusting any scenario, wiggle each input by the same relative amount and watch the output. In the chain above, ROI is linear in every factor, so a 20% error in conversion rate distorts the result exactly as much as a 20% error in lift. The practical difference is that conversion rate, value, and margin are measured, so their error bars are small, while lift is a judgment. That concentration is healthy: it means the forecast argument is really an argument about one number, and the review discussion can focus there instead of relitigating arithmetic.
The discipline that follows: fund what survives the conservative case, treat base as the plan, and never present upside as the forecast. Then re-measure against the same baseline every cycle; a forecast that is never reconciled with actuals is marketing.
The AI Visibility Adjustment
AI answers break the neat sessions-to-revenue chain in one specific way: a buyer can be influenced by an answer that names your brand, then arrive later as direct traffic, a branded search, or not at all before talking to sales. The click-attributed model above therefore understates the value of answer-layer visibility, and no honest calculator can fix that with a made-up multiplier.
What works instead is separating measured from assumed. Keep the click-attributed ROI as your defensible floor. Alongside it, track the leading indicators that answer-layer work actually moves: citation rate and Share of Model on the prompts tied to revenue topics, per engine, over time, via AI citation tracking. If those indicators rise and branded demand rises with them, you have a documented correlation you can reason about openly, which is a stronger position in a budget review than a fabricated attribution rate. This is also the loop AEO Goal automates as an agent: it finds the visibility gap, ships a concrete fix, and re-checks the indicator, so the “did it work” column in your model fills itself in. The strategic background is covered in AEO vs traditional SEO.
Common Mistakes
A single point estimate. One number with no range communicates false certainty and cannot be stress-tested. Three scenarios or it is not a forecast.
Borrowed benchmark rates. Covered above; the most frequent corruption of this model, and the easiest to avoid since your analytics already has the real rate.
Revenue instead of profit. Skipping margin flatters every case and gets found out by finance eventually, at the cost of the whole model’s credibility.
Static baselines. If organic traffic is already trending up or down, lift must be measured against the projected trend, not last month’s snapshot, or you will attribute momentum to the initiative.
Forecast without reconciliation. The model’s second job is being re-run with actuals. Teams that skip this ship the same optimistic lift assumption every year because nothing ever falsified it.
Claiming 100% attribution. SEO shares credit with brand, product, and sales motion. A model that books every incremental conversion to the initiative invites a fight it will lose; state the attribution assumption and let reviewers adjust it.
Frequently Asked Questions
What ROI should an SEO program target? There is no universal threshold; the honest comparison is against your alternatives for the same budget and your payback tolerance. What the model guarantees is that the comparison happens on explicit assumptions instead of vibes.
How long before SEO work shows in the numbers? Long enough that monthly ROI checks on a new program mostly measure noise. Set the review horizon when you set the forecast (the worked example used six months) and judge against the written-down ramp, not the calendar month the invoice landed.
Can this model justify AEO work specifically? Yes, with the split described above: click-attributed floor plus measured leading indicators. What it cannot honestly do is convert a citation rate into revenue with an invented coefficient, and any tool that does so is generating fiction with extra steps.