Share of Model analytics: are you winning the category conversation?
Share of Model analytics measures how often, and how prominently, a brand appears in AI-generated answers relative to its competitors for a defined set of prompts. Where traditional analytics counts clicks and rankings, share of model counts presence inside the synthesized answer itself: across systems like ChatGPT, Perplexity, and Google AI Overviews, what proportion of the relevant conversation does your brand occupy versus the alternatives?
The term borrows from the classic marketing idea of mindshare - the degree to which a brand owns a slice of customer attention - and applies it to the answer layer. You can read the formal definition in our share of model glossary entry. The practical point is that a single brand mention is a data point, while share of model is the comparative picture that tells you whether you are winning or losing the category conversation. AEO Goal is built to produce that picture and act on it: it is an AEO agent, so it does not stop at the number, it ties each gap in your share to a specific fix and re-measures whether the number moved.
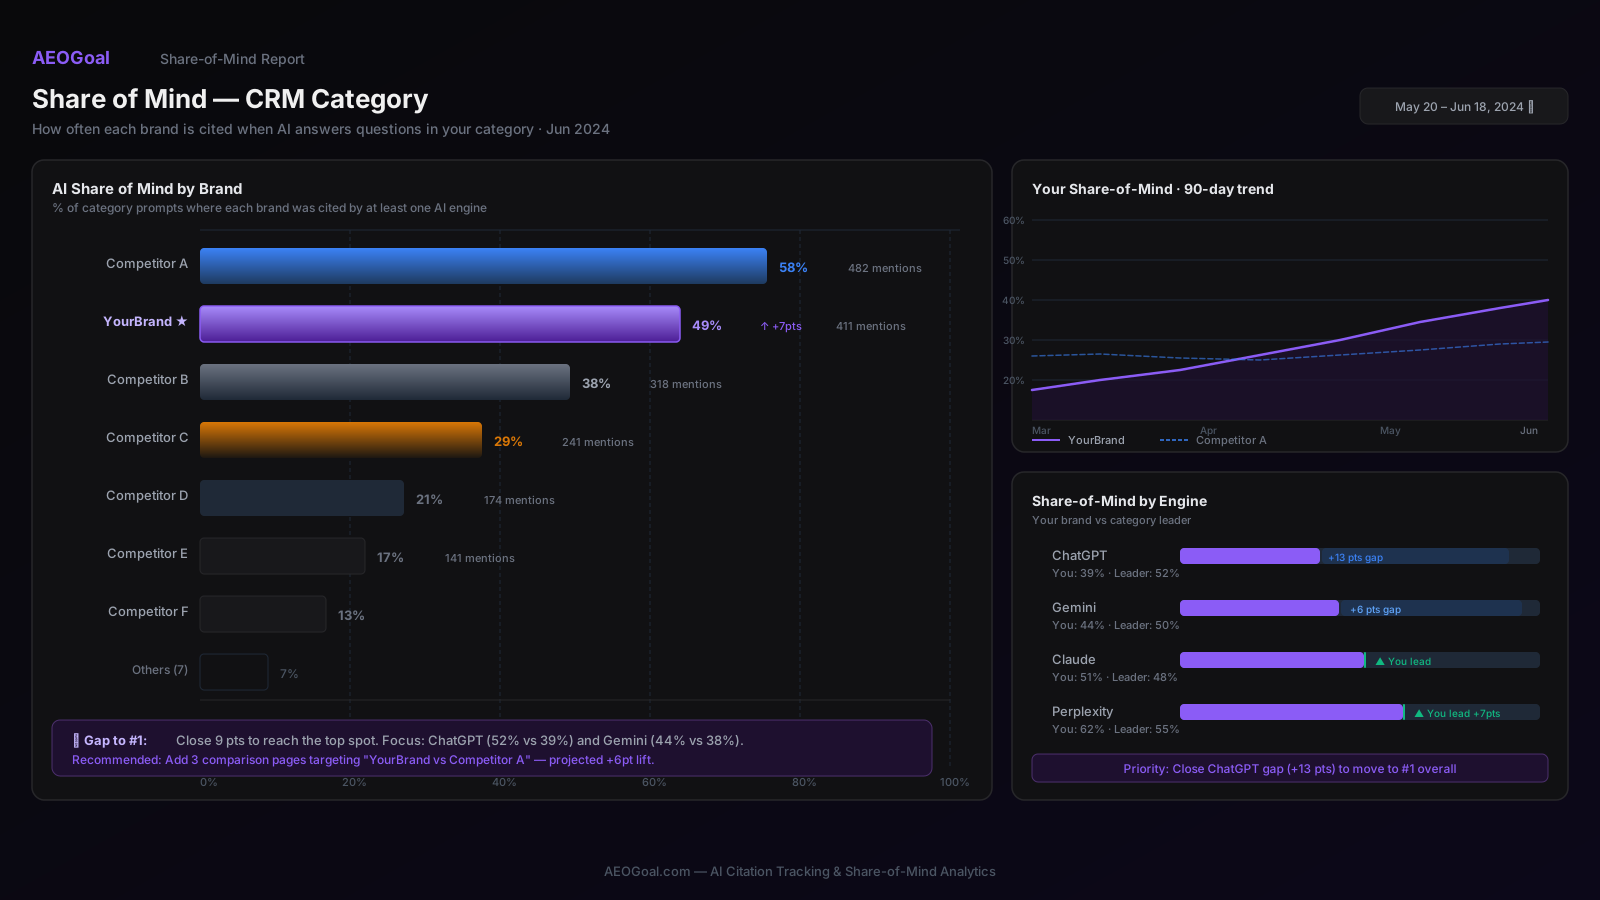
How share of model is measured across AI systems
Share of Model is measured by running a representative library of buyer prompts against multiple AI systems, recording which brands are named in each answer, then expressing your brand’s appearances as a proportion of all competitor appearances for that prompt set. Sentiment and citation quality refine the raw count into something decision-grade.
A credible measurement accounts for several dimensions:
- Presence. In what share of priority prompts is the brand named at all?
- Prominence. Is the brand listed first, framed as the recommendation, or buried as an afterthought?
- Sentiment. Is the mention positive, neutral, or a caveat?
- Co-occurrence. Which competitors appear alongside, and which crowd you out entirely?
Because answers vary between systems and shift over time, the honest metric is a trend tracked across repeated windows, not a single reading. The mechanics of capturing and attributing these mentions are detailed in our AI citation tracking methodology, and the underlying unit - an AI citation - is what makes prominence and source attribution possible.
Weighting matters as much as counting. A mention where you are named first and recommended is worth far more than one where you appear in a list of eight also-rans, and a positive framing is worth more than a caveat. A credible share-of-mind figure reflects that - it is not a raw tally of appearances but a weighted picture of how much of the answer, and how much of the recommendation, you actually own. That is what lets you distinguish being present from being preferred, which is the distinction that ultimately shows up in pipeline.
A headline number is not a plan. AEO Goal makes it actionable.
Plenty of tools will give you a single “AI visibility” or “share of voice” figure. The problem is that a headline number, on its own, tells you nothing about what to do. Is your 22% share low because competitors own three specific high-intent prompts, or because you are thinly present everywhere? Those call for completely different responses, and a composite score hides the difference.
AEO Goal is built to decompose the number into a plan. It shows share of model per prompt, per competitor, and per engine, so you can see exactly which conversations you are losing and to whom - then it attributes each gap to a content, entity, or technical cause and ships the fix. That is the difference between a metric you report and a metric you can move.
How AEO Goal delivers share of model analytics
AEO Goal turns scattered AI mentions into a comparative share-of-mind view, then ties each gap to an action. It runs your prompt library across multiple AI systems, attributes mentions and citations, computes your standing against named competitors, and surfaces where owned content could close the gap.
The workflow is an operational loop:
- Define the field. Set the market, brand, priority competitors, and the prompts that mirror real buyer research.
- Baseline. Capture mentions, citations, source URLs, sentiment, and competitor overlap to establish the starting share.
- Diagnose. Identify which prompts competitors own and why, mapping each to content, entity, or technical causes.
- Act. Brief and produce answer-first content aimed at the prompts where you are losing ground.
- Re-measure. Re-run the set on a cadence and report whether share of model moved.
The cadence is what makes share of model a management metric rather than a curiosity. A one-time reading tells you where you stand; a tracked trend tells you whether your strategy is working, whether a competitor is gaining, and whether last quarter’s content investment actually bought you category presence. Because AEO Goal re-runs the identical prompt library each window, the comparison is apples-to-apples - movement reflects real change in the answers, not a different question set - so the number is safe to put in front of a board and safe to steer a roadmap by.
A worked example
Suppose your baseline share of model is a respectable-looking 30% across the category, but the per-prompt view tells a sharper story: you own the low-intent informational prompts and are almost absent from the three “best tool for X” and comparison prompts that actually precede a purchase. A single score would have hidden that. AEO Goal surfaces it, traces the absence to a missing comparison page and a competitor whose page is cited across two engines, and briefs the answer-first page to contest it. On the next measurement window, you watch your share on those specific high-intent prompts - the ones that matter - rather than a vanity average.
That per-prompt decomposition is the difference between a number that flatters you and a number that directs you. A 30% average can hide a catastrophic loss on the exact prompts that convert, and it can equally understate a strong position on the questions that matter most. Share-of-mind analytics only earns its place when it can be sliced to the prompts, competitors, and engines where the buying decision is actually being made - which is exactly where AEO Goal points the fix.
Why share of model matters more than a single ranking
Because AI answers usually name only a handful of options, presence is increasingly winner-take-most: the brands inside the answer get considered, and everyone else is invisible regardless of where they rank in a classic results page. Share of Model captures that comparative reality in a way a single keyword position cannot. It is also the metric executives intuitively understand, which makes it a strong reporting anchor. For the strategic contrast with click-based measurement, see our overview of AEO versus traditional SEO.
There is a deeper reason share of model belongs at the top of an AEO report. Rankings and traffic are inputs; category presence in the answers buyers actually read is much closer to an outcome. When a prospect asks an AI assistant which tools to consider and your brand is one of the three it names, you have influenced the shortlist before a single click - and when you are absent, no amount of ranking on page two recovers that lost consideration. Share of Model is the metric that keeps a team focused on that outcome, and tracking it per competitor is what turns “are we doing AEO?” into “are we winning it, and against whom?”
What you can finally answer
- What proportion of the category conversation do we own versus each competitor, per engine?
- Which specific high-intent prompts are we losing, and to whom?
- Is our share trending up or down over the last few measurement windows?
- Which fix would recover the most share, and did last quarter’s work move it?
Who it is for
- Marketing leaders and executives who want a single, defensible measure of category position in AI answers.
- Competitive and product-marketing teams tracking whether a rival is pulling ahead in the answer layer.
- SEO and content teams who need the per-prompt decomposition to know what to work on next.
An honest boundary
AEO Goal does not guarantee a higher share. Third-party platforms control their own answers, so the deliverable is an accurate, repeatable measurement and an improving trend, never a promise of dominance. What it does is turn scattered mentions into a comparative picture, decompose that picture into a prioritized set of fixes, and prove whether your share moved. To act on the gaps a share-of-mind view reveals, explore how competitor AI visibility breaks down where rivals win and how AI visibility tracking monitors presence over time - or run a free AI visibility scan to see your starting share.